Overview
The shaper tool is one of the key interfaces in Parallax used to create and maintain resource plans for both deals in the sales pipeline and active projects. The Project Shaper provides the full scope of a single project. It will show all of the service offerings within a project and provide feedback on the planned hours using colors. Making changes in the Project Shaper is specific to the project and do not overwrite service offering templates.
Getting to the Project Shaper:
- Click on Active Projects or Sales Pipeline
- Click on the Project of Choice
- Click on the Shape Project button
| The Shaper Interface | A General Overview of the Shaper |
| Header | This covers what you'll find in the Header and what it's for. |
| Dimensions | Dimensions are what find in the left-hand columns of the Shaper - check out here what can be found in Dimensions and how to use it. |
| Time Off | See here for info on where to find Time Off and Holidays in the Shaper and how to add more! |
| Measurements | Check out an overview of the Measurements area within the shaper - this is Cells where Allocations and Actuals are shown. |
| Cell Colors | A quick breakdown of the Cell Colors and what they mean. |
| Footer | Info on the Shaper's Footer and what it's used for. |
The Shaper Interface
The Shaper interface can be divided into four main areas:
a. Header - This is where you'll find identifying information about the Project, and apply filters.
b. Dimensions - This is where you can see the Offering Names, Assigned People/Roles and Rates/Hours/Revenue.
c. Measurements - This is where you'll view the Offering Start/End Dates, Allocations, and Actual Hours from Timesheets.
d. Footer - This is where you can change how you view the Cells (Denominator, View, Data).
See below for more info on each area.
Header
The header gives you basic information about the Project as a whole, and ways to filter the information you're seeing:
Project Info - In the top left corner, you will see your client name and project dates. If you find yourself needing to adjust project dates, this can be done here.
Filters - The header is also the main hub for all of your filtering needs. The Staffing box gives you the option to filter by all roles, assigned roles, or unassigned roles. The
-
Data points - Additional project numbers also live in the project header, including:
Target Revenue >This shows the target budget for the project compared to what’s been planned. This number is initially set using the deal amount from CRM. However, once a project is active, you can adjust it in the project financial settings.
Projected Revenue, Projected Costs, and Projected Margin >These numbers are calculated based on the actual hours to date plus the remaining planned hours for all resources on the project. As you add or remove planned hours, these numbers change accordingly.
Additional Assignment Filters - Click the icon of three descending lines (next to Staffing) to adjust these filters, and also filters by Status and Stages.
Exit Shaper - The "X" in the right-hand corner allows you to exit the Shaper and return to Project Overview.
Dimensions
The section on the left side of the Shaper (also known as Dimensions) allows you to things like Rates by Assignment. Here you can:
Organize the Roles within Offerings. You can sort all Offerings Alphabetically by People or Project Roles, or drag Assignments where you want them, using the three-line icon to the left of the Roles.
Switch the applicable Column data between Financial and Hours.
View and make Role-specific changes to Assignments (see below).
Select the Visible Fields (columns) you'd like to see and which Data Type applicable Totals are based on. Check out this article on how Visible Fields and Data Types work.
Open an Employee's "drawer" to see their other Assignments.
Use Edit Mode, to update other Project Assignments.
Use Hover options to make broad changes to a Role. Hover options include:
-
-
- Assign/Unassign - Use this "+" or "-" icon to add or remove someone from a Project Role.
- Tag - Use the Tag icon to add a Tag to the Project Role.
- Notes - Use the Note icon to add a Note to a given Role.
- Delete - Use Trash Icon to remove the Assignment.
- Change Role - Use this option to swap out the Project Role on a Person.
- Duplicate Role - Use this option to clone an Identical Project Role that is unassigned.
- Duplicate Role to Other Offering - Use this option to clone an identical Role onto a different Project.
- Trim to Capacity - Use this option to remove hours that extend beyond the Person's Capacity.
- Fill to Capacity - Use this option to fill in a Person's Allocations based on their availability.
- Override Role Name - Select this option to create an alias for this Role. See this article for more info.
- Associate Role(s) - Use this option to Associate one Role to another, indicating that one is taking over for the other. See this article for more info.
- Go to Profile - Jump to the Person's Profile in Settings > People.
- Complete Role - This option ends a Role so you can make it invisible. See here for more info.
-
For a full breakdown on how to assign a Person to a Role, check out our article here: Assigning People to Roles
Time Off
In addition to viewing Time Off and Holidays in the Drawer mentioned above, you can now add Time Off. Just do the following:
- Open an Person's Drawer
- Click on any Cell in the Time Off Column
- On the module that appears, select the Date Range you want to add Time Off within and click "Add"
- Fill in the intended Time Off Hours for each day (Click the "-" icon to skip a day)
- Then click Save - and you're done!
Hovers
Hover over the cell to see a dark outline and a menu icon. Select the menu icon to open the list of options:
Offering Row
Reorder arrow (left). Edit Offering Name, Duplicate, and Add Role (right).
Role Row
Reorder arrows (left). Unassign Person from Role, Tags, Delete, and More Menu (right). Change Role and Duplicate (dropdown options).
Assignments Row:
Tag and View Project (right).
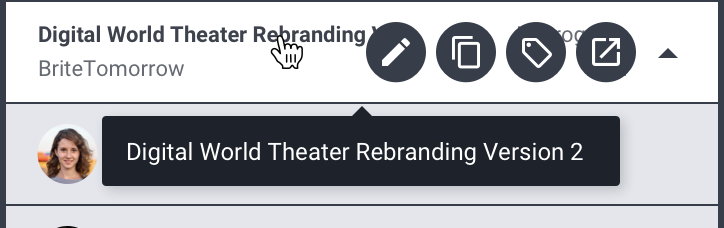
Project Name:
Hover over a project with a long name to see the full name in a label.
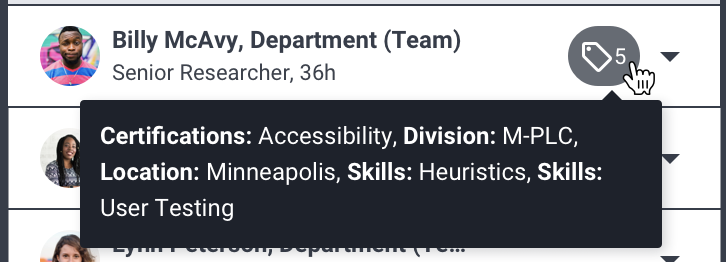
Tags:
Hover over the Tags icon anywhere to see all the Tags that are applied.
Measurements
The Measurements area is the main cell area is where you can bring your project to life by adding and removing hours to cells. There are a few different ways in which you can allocate hours and we talk through some tips and tricks in the article Allocating Hours to Roles.
- The offering start and end dates can not be before the project start date (reminder— the project dates can be found in the header!) If you move the service offering plan past the planned project end date, you will be asked if you want to update the planned end date for the project.
Note: You can also left-click here to shift the offering to a new start date you select from a calendar. - Today's date is identified on the shaper by the blue highlight and dashed vertical line.
-
Project/Offering Header options: Right-Click (Windows) or CTRL+Click (Mac) on the header and you can select from the following options:
- Change Start Date: This will shift move the entire offering, and shift all shapes accordingly.
-
Push Out: Allows you to push selected Column and everything after back to a Calendar Date you select.
Important: Columns may only be pushed forward in time (to the right), they cannot be pulled back to an earlier date (to the left). - Clear Column*: Use this option to clear an entire column within an offering.
-
Cell Options (see below): You can also Right-Click (Windows) or CTRL+Click (Mac) on a Cell for the following options:
- Add Allocations: Use this option to bulk add hour allocations by Day for a Date range you choose*.
- Push Out: Allows you to push out selected Cell and everything after back to a Calendar Date you select. Important: Like Offerings, Cell contents may only be pushed to forward (to the right), not the backward (to the left).
- Clear Left/Clear Right/Clear All: Clears every Cell to the Left, every Cell to the Right or all Cells within the Row, based on which you select.
Note: The Right-Click options for Project and Offering do not affect Time Off that has been added. Instead, you'll manage changes to Time Off, through the Time Off Module that appears when clicking in the Time Off Column.
Parallax Tip
When using Add Allocations, if you want to add the hours each day for the whole project offering, you can save time by selecting Project Duration, instead of Select Date Range.

Cell Colors
The color of cells gives you a quick visual representation of the project type and the project's health. The darker the shade of color, the closer the cell is to 100% booked.
Keep an eye out for red cells as those identify that you are over your available hours based on your profile capacity set. A red alert bar will appear over the top of a cell when the Person is over their billable capacity.
For example: If someone is set to Billable Capacity of 75% total capacity and is set to work 40 hrs per week, this means the total hours for billable work is 30 hrs per week. The cell would be blue with no red capacity bar. If however, you are including in the view Non Billable and Billable work and the hours are over 30 hrs, then the red capacity bar will appear as over capacity if those hours are over 30 per week.
Hours that have been planned show up in bold at the top of a cell. You can see the actual hours from your integrated timesheet appear below the planned hours. If the actual hours come in over what was planned, the actual hours will be red and bold.
Note: The capacity red bar in the Project shaper captures capacity at the time the person was assigned and does not look at current capacity at a whole overall in the moment. This view can be found in the Assignments View. To update in Project Shaper, remove them from the role then re-add to the role and this will update the view.
Footer
The footer will be your go-to for adjusting your Measurements area viewport. In the Project Shaper, the default viewport starts at the beginning of your project.
-
- For easy reference, you can find the Timeline Key (legend) in the bottom left-hand corner of the Parallax app
- Download CSV option - allows you to export the shaper details
- The Start and Today buttons will help you quickly navigate around the Measurements area.
- Start: This button will bring you to the project start.
- Today: This button will bring you to today. This is the default view when opening the project shaper.
- Undo and Redo allows you to remove changes you have made or re-apply them but, you do need to be in the same sessions and browser to use these. If you exit and come back later to revise, these will not be functional.
- Viewing options for the Measurements area:
- Denominator: If you would like to remove the actuals from the cell view (on by default), chose the none option.
- View: By default, hours are added to the shaper at the week level and are evenly distributed across the 5 workdays in that week. You have the option to switch to either day or month view as well. If your project requires weekend work, you can add planned time to specific weekend days by choosing the day view and entering allocations directly into the cell. Spreading allocations across a weekend will not add allocations.
- Data: If you would like to view your cell data in percentages, rather than hours, you can make that switch here.
- Hide: PTO or Holiday Icons
-