Overview
In professional services and digital organizations, visibility into how your team spends their time directly impacts profitability and operational performance. The Utilization Breakdown report in Parallax gives you that visibility — helping you see where hours are being worked, how productive that time is, and whether your team is working toward defined targets.
The Parallax Utilization Breakdown report not only tells you how much time your team is working — it shows how that time is being used and whether it aligns with company goals. By combining powerful filters, visual summaries, and clear utilization formulas, you get both high-level insight and deep analytical detail.
What Is Utilization — And Why It Matters
At its core, utilization is a measure of how effectively a person or team is spending their available hours on work that matters to the business. It answers key questions like:
Are team members spending time on billable client work?
Are internal investment initiatives consuming productive capacity?
Is non-billable admin work taking time away from revenue generation?
In Parallax, utilization is expressed as a percentage of Available Capacity — the actual hours someone could work after accounting for time off and holidays. Each person and role in your organization can have a Target Utilization goal, which you use to benchmark performance against expectations
The Purpose of the Utilization Breakdown Report
While the Utilization Overview report (a separate Insights report) shows how your organization is performing against targets over time, the Utilization Breakdown report lets you:
See how time is being spent across different types of work.
Analyze utilization for Teams, Roles, or individual People.
Compare Billable, Productive, and Total utilization against goals.
It’s a powerful tool for diagnosing where planning or execution may be misaligned, and where you can improve profitability and operational efficiency.
Why These Metrics Matter
Tracking utilization gives you insight into whether capacity is being used effectively and highlights opportunities to:
Reallocate admin tasks
Increase billable delivery
Balance workload across teams
Align planning with execution
By separating billable, productive, and total utilization, you also gain a nuanced understanding of how work contributes to revenue, strategic initiatives, and operations.
Navigating the Utilization Breakdown Report
1. Filters & Report Customization
The top of the report includes filters that help define the scope of the data you’re viewing. You can segment by:
Department
Role
Worker Type
Tags
Date range
These filters help you focus your analysis on the specific dataset that matters to you.
(2) Summary Charts
After choosing filters, the report shows summary visualizations that compare:
Utilization vs Target
Billable Utilization
Productive Utilization
Target Utilization
Each metric is expressed as a percentage of Available Capacity, giving you a sense of how close your team is to achieving goals. The first of these Charts is focused on your Utilization as compared with your Target:
We’ve tried to make the left side Summary Chart as simple and straightforward as possible - it surfaces the Billable and Productive Utilization compiled for the dataset and range you’ve selected and compares it to the compiled Target Utilization. These metrics can be defined as.
- Billable Utilization - The combined total Hours spent on Client Billable (Client T&M, Fixed Bid, Fixed Retainer) Offerings and Client Non-Billable* Offerings.
- Productive Utilization - The combined total Billable Utilization, plus Internal Investment Offerings.
- Target Utilization - The combined Target Utilization goals for the dataset (as set for Roles or People under the respective Settings pages).
Each of these is shown as a percentage of Available Capacity, allowing you to quickly and daily see how close you are to your goal! This shows how hours are distributed across project categories.
The right-side Summary Chart then illustrates where that time is being spent. This breakdown shows you a graph of the combined Total Hours of your dataset and range, breaking down into segments to illustrate where your time is being used. Those segments are:
- Billable Hours - Hours spent on Client Billable (T&M, Retainer, Fixed Bid) Offerings within Client Projects.
- Client Non-Billable - Hours spent on Non-Billable Offerings within Client Projects.
- Internal Investment - Hours spent on Investment Offerings within Internal Projects.
- Internal Admin - Hours spent on Admin Offerings within Internal Projects.
- Time Off - The combined Time Off Allocations (for future dates within selected range) and past Time Off Actuals (for past dates within range).
- Holidays - The combined Time Off Allocations (for future dates within selected range) and past Time Off Actuals (for past dates within range).
- Remaining Capacity - Hours remaining to reach Total Capacity.
Each of these segments are shown as a percentage of Total Capacity (all possible Hours based on Schedule), allowing you to see at a glance where your team’s time is being spent!
Parallax Tip: Why do the right and left Summary Charts show different Billable percentages?
This is expected - the left Summary Chart is intended to show Utilization (which is based on Available Hours), whereas the right Summary Chart is intended to account for every potential hour, so it uses Total Hours, including those which are unavailable for work.
(3) Drill Downs/Search/Columns Filter/CSV
Below the visuals, the dataset table provides granular data:
People, Roles, Departments, etc.
Utilization visuals per segment
Detailed utilization percentages for each grouping
Here you can search, filter columns, or export the raw data for further analysis.
To the right, you'll find the Columns Filter; clicking the Eye Icon allows you to select which Columns you do and do not want to see, in order to hide any data not currently relevant to you. Next to it, you'll find the Search option for honing in on a specific Department/Role/Person/Location/Tag and an option to download your dataset as a CSV.
(4) Dataset Table 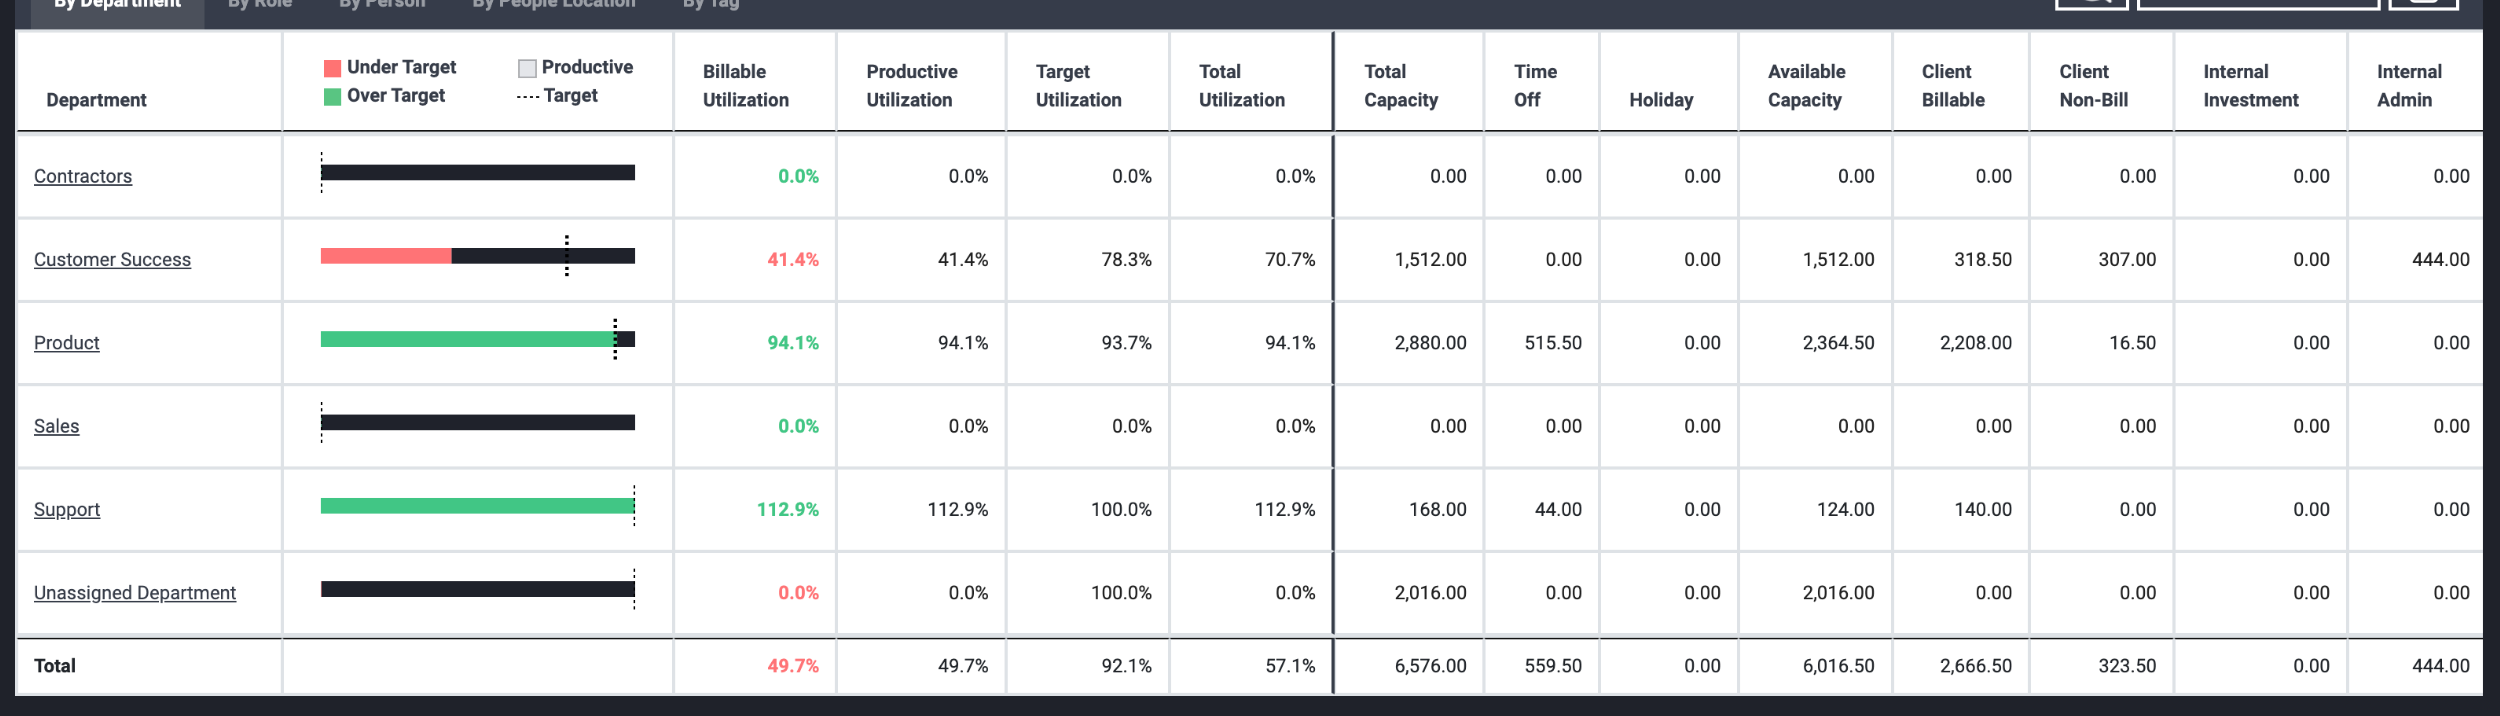
The Dataset Table represents the meat of the Utilization Breakdown. These are the results returned by the Filters you've selected and the Drill Down you've picked, as populated by the Columns you've selected. The data you'll find consists of:
- Segment Info (People, Role, Department, etc.) - This will be the Names identifying each grouping of data you're drilling down to look at (ex: People Names/Roles Departments in By People drill down). What's included will depend on which drill down you're using, but in short, it's the info that defines the individual groupings you're looking at.
- Utilization Visual - This column contains a microcosm of the left-side Summary Chart, showing a visual of the same Utilization data, but applied to the individual Person, Role, etc. instead of the entire segment.
-
Utilization Percentages*
- Billable Utilization - Billable Utilization will be the Total Billable Hours (T&M, Retainer, Fixed Bid and Client Non-Billable*), expressed as a percentage of the Available Capacity for the Person, Role, etc. and represents individualized data shown in aggregate on the left-side Chart above.
- Productive Utilization - Like Billable Utilization, Productive Utilization is the individualized data populating that makes up the left-side Summary Chart. As above, Productive Utilization is defined as time spent towards Productive Offerings (Client Billable + Client Non-Billable Hours + Internal Investments), shown as a percentage of Available Capacity for the Person, Role, etc.
- Target Utilization - Target Utilization is the Utilization Target set by the Person (by Person View) or the combined Utilization Targets set for the group (Department, Role, etc.) as calculated based on Available Capacity. Find out more about setting Utilization Targets in this article.
- Total Utilization - Total Utilization represents the total Hours spent on any Projects (not including PTO/Holidays) as expressed as a percentage of Available Capacity for the Person, Role, etc.
NOTE: For holidays that occurred in the past the Breakdown Report will not show reduced capacity during the holiday however, it will show capacity reduced for the future holiday weeks/days instead. If you wish to have reduced capacity tracked in the past, we recommend you utilize a Holiday Project and Timesheet where holidays and actuals are recorded. If not Project PTO or Holiday Project is set in Parallax, the view for the PTO and Holiday columns are intended to be at 0 even if holidays are taken.
*Parallax Tip - Utilization Cheat Sheet!
Just want the formulas for Utilization? Here are how we're using the Columns to calculate:
- Billable Utilization = (Client Billable + Client Non-Bill if Included) / Available Capacity
- Productive Utilization = (Client Billable Column + Client Non-Bill Column + Internal Investment) / Available Capacity
- Target Utilization = Target Utilization found in Settings > People.
- Total Utilization = (Client Billable Column + Client Non-Bill Column + Internal Investment + Internal Admin) / Available Capacity
-
Total Capacity - As mentioned above, the purposes of this report, Total Capacity is defined as the maximum hours possible. It's calculated as the sum of all Schedules for all People within the Dataset, with no modifications applied.
(As an example, if all People in your Organization used a standardized Schedule in Settings > Customization, you would calculate this as: Standard Schedule x # People x # Business days).- Time Off - This section summarizes any applicable Time Off Plans scheduled through the Assignments View (in the future) and/or Time Off Actuals recorded through a Timesheet on Settings > Time Off (in the past).
- Holiday - This section summarizes any applicable Holidays scheduled through the Settings > Time Off page (in the future) and/or Holiday Actuals recorded through a Timesheet on Settings > Time Off (in the past).
-
Available Capacity** - Available Capacity is defined as Total Capacity, minus any omitted Time Off or Holiday during which a Person is not present (and therefore not available for work).
- Billable Capacity % - This is the Billable Capacity percentage that is set on Settings > People for the individual (or combined percentage for the Role, Department, etc.).
- Billable Capacity - This is the individual/grouping's Billable Capacity % but converted into Hours using Available Capacity.
- Client Billable Hours - These are the Hours being spent on T&M, Retainer or Fixed Bid Offerings.
- Client Non-Billable Hours - These are the Hours spent on Client, Non-Billable Offerings. They represent Hours on an Offering that you're essentially billing at $0.
- Internal Investment - These are Hours spent on the Investment Offerings within Internal Projects. They represent the Hours that are productive towards future business, but not Billable towards a specific Client.
- Internal Admin - These are Hours spent on the Admin Offerings within Internal Projects. These are Hours not attributable to any specific growth opportunities or generation of business.
**Parallax Tip - Client Non-Billable Hours
The default (and recommended) assumption that Non-Billable Client work is still considered to be Billable for the purposes of tracking Billable Utilization. However, they can be manually adjusted to be considered Productive, but not Billable. Find out more here.
**Parallax Tip - Time Off/Holidays and Productivity
- Parallax thinks of Time Off and Holidays as time that your Team is not physically present, thus reducing Available Capacity and normalizing their Utilization to account for absence. While it is not recommended, you can choose to include Time Off and/or Holidays in your Available Capacity calculation (click here for more information), however, know that this can skew Billable Utilization since it gives the appearance that your Team has more time than they truly do - plus you can can still see the impact of PTO/Holidays using the Total Capacity column. For more information, check out this article.
To EXPORT this report, please use the dedicated Printer Icon found on the page which offers csv, Excel or copy options.
How Utilization Is Calculated in Parallax
Parallax defines utilization metrics with clear formulas based on hours tracked and available capacity. All utilization metrics use the same denominator:
Available Capacity
Before utilization can be calculated, Parallax determines how many hours a person could work:
Available Capacity = Total Capacity − Time Off − Holidays
Where:
Total Capacity = Total scheduled working hours based on schedules and business days
Time Off / Holidays reduce available hours (so utilization isn’t inflated)
Productive Utilization
This includes all client work and internal investment work (value-add internal tasks), but excludes admin:
Productive Utilization (%) =
(Client Billable + Client Non-Billable + Internal Investment)
÷ Available Capacity
× 100
Example:
32 client billable + 8 non-billable + 4 hours of internal investment:Productive Utilization = (32 + 8 + 4) / 40 × 100 = 110%
Note: This can go above 100% if workload exceeds a person’s available hours.
Total Utilization
This measures all project-related work, including internal admin:
Total Utilization (%) =
(Client Billable + Client Non-Billable + Internal Investment + Internal Admin)
÷ Available Capacity
× 100
Target Utilization
This is the goal utilization percentage that was set for the person or group in Settings. It’s not a calculated value — it’s a target for comparison.
Utilization Metrics & Formulas
Once Available Capacity is known, Parallax calculates the following:
Billable Utilization
This measures how much of the available time is being spent on billable client work:
Billable Utilization (%) =
(Client Billable Hours + Client Non-Billable Hours if included)
÷ Available Capacity
× 100
Example:
If someone has 32 billable hours and 8 hours of client non-billable work in a week with 40 hours available:
Billable Utilization = (32 + 8) / 40 × 100 = 100%